小能豆
阅读 63
2025-02-27
数据立方体中多个像素的平均光谱
py我有一个适合的数据立方体,其中包含 3 个轴上的银河经度、纬度和速度。为了从数据立方体中提取经度和纬度特定像素值的光谱,我使用函数
cube[:, 1935, 1407].quicklook()
plt.show()
并使用函数提取图像
cube.to_pvextractor()
plt.show()
此处附有样本光谱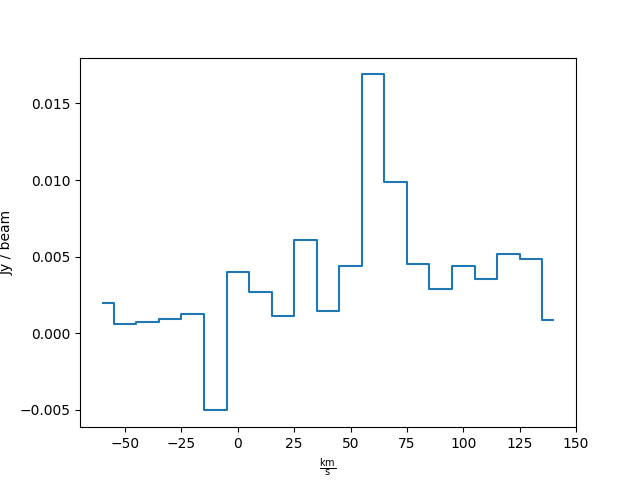 和放大的图像。
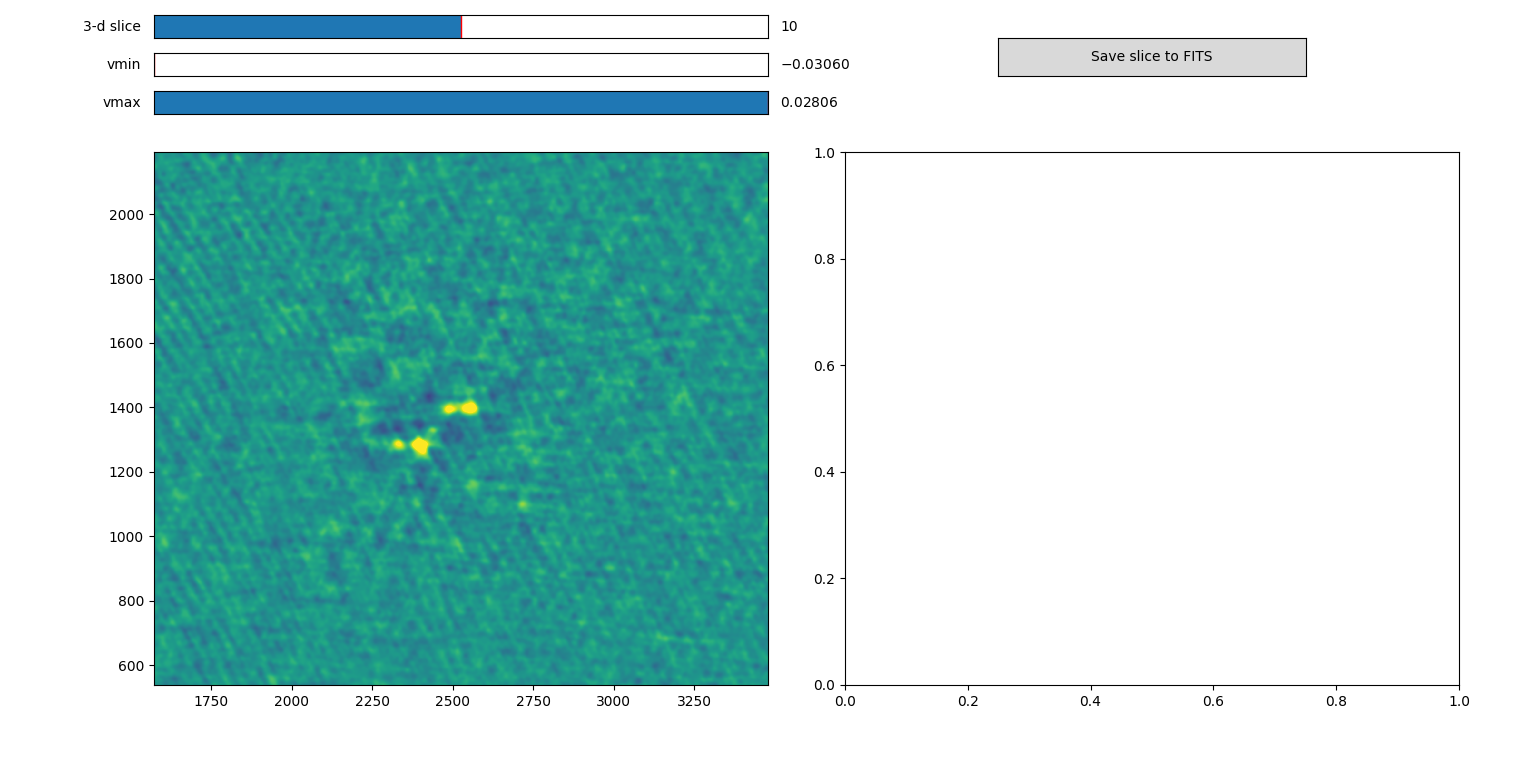
亮点是检测结果。如何使用多个像素并平均光谱以获得平均光谱,以便减少噪音并分析峰值?我一直在尝试编写代码,但我不知道如何继续,因为我是 Python 新手。有人可以给出提示吗?
阅读 63
2025-02-27
共1个答案
小能豆
您可以使用spectrapepper来实现此目的:
import spectrapepper as spep
import matplotlib.pyplot as plt

# load sample data from library
x, y = spep.load_spectras()

# calculate the average spectra of the set
avg = spep.avg(y)

# plot the result compared to the data set
for i in y:
    plt.plot(x, i, lw=0.5)
plt.plot(x, avg, c='red', lw=1)
plt.show()
该库还提供了其他数据集分析工具。请查看其中包含的示例 6docs,了解更多类似性质的选项。
2025-02-27